FAI is a tool for unattended mass deployment of Linux. It’s a system to install and configure Linux systems and software packages on computers as well as virtual machines, from small labs to large-scale infrastructures like clusters and virtual environments. You can take one or more virgin PC’s, turn on the power, and after a few minutes, the systems are installed, and completely configured to your exact needs, without any interaction necessary.
Engineering and technology
GitHub – MicrosoftDocs/mslearn-troubleshoot-inbound-network-connectivity-azure-load-balancer: Code samples and resources for learn module “Troubleshoot inbound network connectivity for Azure Load Balancer”
A tcpdump Tutorial with Examples
Let’s start with a basic command that will get us HTTPS traffic:
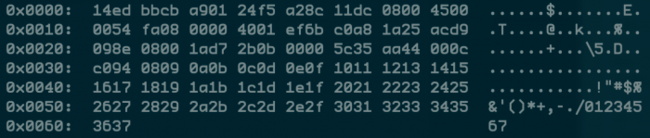
tcpdump -nnSX port 443
04:45:40.573686 IP 78.149.209.110.27782 > 172.30.0.144.443: Flags [.], ack
278239097, win 28, options [nop,nop,TS val 939752277 ecr 1208058112], length 0
    0x0000:  4500 0034 0014 0000 2e06 c005 4e8e d16e  E..4........N..n
    0x0010:  ac1e 0090 6c86 01bb 8e0a b73e 1095 9779  ....l......>...y
    0x0020:  8010 001c d202 0000 0101 080a 3803 7b55  ............8.{U
    0x0030:  4801 8100
You can get a single packet with -c 1, or n number with -c n.
This showed some HTTPS traffic, with a hex display visible on the right portion of the output (alas, it’s encrypted). Just remember—when in doubt, run the command above with the port you’re interested in, and you should be on your way.
Examples
PacketWizard™ isn’t really trademarked, but it should be.

A PRACTITIONER PREPARING TO RUN TCPDUMP
Now that you are able to get basic traffic, let’s step through numerous examples that you are likely to need during your job in networking, security, or as any type of PacketWizard™.
everything on an interface
Just see what’s going on, by looking at what’s hitting your interface.
Or get all interfaces with -i any.
tcpdump -i eth0
find traffic by ip
One of the most common queries, using host, you can see traffic that’s going to or from 1.1.1.1.
Expression Types:
host, net, and port.
Directions:
src and dst.
Types:
host, net, and port.
Protocols:
tcp, udp, icmp, and many more.
tcpdump host 1.1.1.1
06:20:25.593207 IP 172.30.0.144.39270 > one.one.one.one.domain:
12790+ A? google.com.
(28) 06:20:25.594510 IP one.one.one.one.domain > 172.30.0.144.39270:
12790 1/0/0 A 172.217.15.78 (44)
filtering by source and/or destination
If you only want to see traffic in one direction or the other, you can use src and dst.
tcpdump src 1.1.1.1
tcpdump dst 1.0.0.1
finding packets by network
To find packets going to or from a particular network or subnet, use the net option.
You can combine this with the src and dst options as well.
tcpdump net 1.2.3.0/24
get packet contents with hex output
Hex output is useful when you want to see the content of the packets in question, and it’s often best used when you’re isolating a few candidates for closer scrutiny.
tcpdump -c 1 -X icmp
A SINGLE ICMP PACKET VISIBLE IN HEX
tcpdump is the tool everyone should learn as their base for packet analysis.
show traffic related to a specific port
Common Options:
-nn : Don’t resolve hostnames or port names.
-S : Get the entire packet.
-X : Get hex output.
You can find specific port traffic by using the port option followed by the port number.
tcpdump port 3389
tcpdump src port 1025
show traffic of one protocol
If you’re looking for one particular kind of traffic, you can use tcp, udp, icmp, and many others as well.
tcpdump icmp
show only ip6 traffic
You can also find all IP6 traffic using the protocol option.
tcpdump ip6
find traffic using port ranges
You can also use a range of ports to find traffic.
tcpdump portrange 21-23
find traffic based on packet size
If you’re looking for packets of a particular size you can use these options. You can use less, greater, or their associated symbols that you would expect from mathematics.
tcpdump less 32
tcpdump greater 64
tcpdump <= 128
reading / writing captures to a file (pcap)
It’s often useful to save packet captures into a file for analysis in the future. These files are known as PCAP (PEE-cap) files, and they can be processed by hundreds of different applications, including network analyzers, intrusion detection systems, and of course by tcpdump itself. Here we’re writing to a file called capture_file using the -w switch.
tcpdump port 80 -w capture_file
You can read PCAP files by using the -r switch. Note that you can use all the regular commands within tcpdump while reading in a file; you’re only limited by the fact that you can’t capture and process what doesn’t exist in the file already.
tcpdump -r capture_file
advanced
Now that we’ve seen what we can do with the basics through some examples, let’s look at some more advanced stuff.
More options
Here are some additional ways to tweak how you call tcpdump.
-X: Show the packet’s contents in both hex and ascii.-XX: Same as-X, but also shows the ethernet header.-D: Show the list of available interfaces-l: Line-readable output (for viewing as you save, or sending to other commands)-q: Be less verbose (more quiet) with your output.-t: Give human-readable timestamp output.-tttt: Give maximally human-readable timestamp output.-i eth0: Listen on the eth0 interface.-vv: Verbose output (more v’s gives more output).-c: Only get x number of packets and then stop.-s: Define the snaplength (size) of the capture in bytes. Use-s0to get everything, unless you are intentionally capturing less.-S: Print absolute sequence numbers.-e: Get the ethernet header as well.-q: Show less protocol information.-E: Decrypt IPSEC traffic by providing an encryption key.
It’s All About the Combinations
Being able to do these various things individually is powerful, but the real magic of tcpdump comes from the ability to combine options in creative ways in order to isolate exactly what you’re looking for. There are three ways to do combinations, and if you’ve studied programming at all they’ll be pretty familiar to you.
- AND
andor&& - OR
oror|| - EXCEPT
notor!
raw output view
Use this combination to see verbose output, with no resolution of hostnames or port numbers, using absolute sequence numbers, and showing human-readable timestamps.
tcpdump -ttnnvvS
Here are some examples of combined commands.
from specific ip and destined for a specific port
Let’s find all traffic from 10.5.2.3 going to any host on port 3389.
tcpdump -nnvvS src 10.5.2.3 and dst port 3389
from one network to another
Let’s look for all traffic coming from 192.168.x.x and going to the 10.x or 172.16.x.x networks, and we’re showing hex output with no hostname resolution and one level of extra verbosity.
tcpdump -nvX src net 192.168.0.0/16 and dst net 10.0.0.0/8 or 172.16.0.0/16
non icmp traffic going to a specific ip
This will show us all traffic going to 192.168.0.2 that is not ICMP.
tcpdump dst 192.168.0.2 and src net and not icmp
traffic from a host that isn’t on a specific port
This will show us all traffic from a host that isn’t SSH traffic (assuming default port usage).
tcpdump -vv src mars and not dst port 22
As you can see, you can build queries to find just about anything you need. The key is to first figure out precisely what you’re looking for and then to build the syntax to isolate that specific type of traffic.
Keep in mind that when you’re building complex queries you might have to group your options using single quotes. Single quotes are used in order to tell tcpdump to ignore certain special characters—in this case below the “( )” brackets. This same technique can be used to group using other expressions such as host, port, net, etc.
tcpdump ‘src 10.0.2.4 and (dst port 3389 or 22)’
isolate tcp flags
Source: A tcpdump Tutorial with Examples — 50 Ways to Isolate Traffic | Daniel Miessler
Installing OCRmyPDF — ocrmypdf 11.5.0.post13+g46d0632 documentation
sudo apt-get update
sudo apt-get install -y software-properties-common python-software-properties
sudo add-apt-repository -y \
    ppa:jonathonf/python-3.6 \
    ppa:alex-p/tesseract-ocr
sudo apt-get update
sudo apt-get install -y \
    ghostscript \
    libexempi3 \
    libffi6 \
    pngquant \
    python3.6 \
    qpdf \
    tesseract-ocr \
    unpaper
Source: Installing OCRmyPDF — ocrmypdf 11.5.0.post13+g46d0632 documentation
How to use your Raspberry Pi as a wireless access point
Smoky (dog)
Setting a keyboard shortcut for line space
Global A as Integer

sub Line
    dim document   as object
    dim dispatcher as object
    document   = ThisComponent.CurrentController.Frame
    dispatcher = createUnoService("com.sun.star.frame.DispatchHelper")

    dim args2(1) as new com.sun.star.beans.PropertyValue
    args2(1).Name = "TopBottomMargin.BottomMargin"
    if A = 0 then
        args2(1).Value = 200
        A = 1
    else
        args2(1).Value = 0
        A = 0
    end if
    dispatcher.executeDispatch(document, ".uno:TopBottomMargin", "", 0, args2())
end sub
Source: setting a keyboard shortcut for line space [closed] – Ask LibreOffice
Smith chart – Wikipedia
The Smith chart, invented by Phillip H. Smith (1905–1987), and T. Mizuhashi,[3] is a graphical calculator or nomogram designed for electrical and electronics engineers specializing in radio frequency (RF) engineering to assist in solving problems with transmission lines and matching circuits.[4][5] The Smith chart can be used to simultaneously display multiple parameters including impedances, admittances, reflection coefficients, {\displaystyle S_{nn}\,} scattering parameters, noise figure circles, constant gain contours and regions for unconditional stability, including mechanical vibrations analysis.The Smith chart is most frequently used at or within the unity radius region. However, the remainder is still mathematically relevant, being used, for example, in oscillator design and stability analysis. While the use of paper Smith charts for solving the complex mathematics involved in matching problems has been largely replaced by software based methods, the Smith chart is still a very useful method of showing how RF parameters behave at one or more frequencies, an alternative to using tabular information. Thus most RF circuit analysis software includes a Smith chart option for the display of results and all but the simplest impedance measuring instruments can plot measured results on a Smith chart display.

Source: Smith chart – Wikipedia
Installation · PlatformIO
Source: Installation · PlatformIO
NanoVNA | Very tiny handheld Vector Network Analyzer
Standing wave ratio
In radio engineering and telecommunications, standing wave ratio (SWR) is a measure of impedance matching of loads to the characteristic impedance of a transmission line or waveguide. Impedance mismatches result in standing waves along the transmission line, and SWR is defined as the ratio of the partial standing wave‘s amplitude at an antinode (maximum) to the amplitude at a node(minimum) along the line.
The SWR is usually thought of in terms of the maximum and minimum AC voltages along the transmission line, thus called the voltage standing wave ratio or VSWR (sometimes pronounced “vizwar”). For example, the VSWR value 1.2:1 means that an AC voltage, due to standing waves along the transmission line, will have a peak value 1.2 times that of the minimum AC voltage along that line, if the line is at least one half wavelength long. The SWR can be also defined as the ratio of the maximum amplitude to minimum amplitude of the transmission line’s currents, electric field strength, or the magnetic field strength. Neglecting transmission line loss, these ratios are identical.
The power standing wave ratio (PSWR) is defined as the square of the VSWR, however, this deprecated terminology has no physical relation to actual powers involved in transmission.
SWR is usually measured using a dedicated instrument called an SWR meter. Since SWR is a measure of the load impedance relative to the characteristic impedance of the transmission line in use (which together determine the reflection coefficient as described below), a given SWR meter can interpret the impedance it sees in terms of SWR only if it has been designed for that particular characteristic impedance. In practice most transmission lines used in these applications are coaxial cables with an impedance of either 50 or 75 ohms, so most SWR meters correspond to one of these.
Checking the SWR is a standard procedure in a radio station. Although the same information could be obtained by measuring the load’s impedance with an impedance analyzer (or “impedance bridge”), the SWR meter is simpler and more robust for this purpose. By measuring the magnitude of the impedance mismatch at the transmitter output it reveals problems due to either the antenna or the transmission line.